

AdaptaBrasil brings 10 km climate scenarios to Latin America
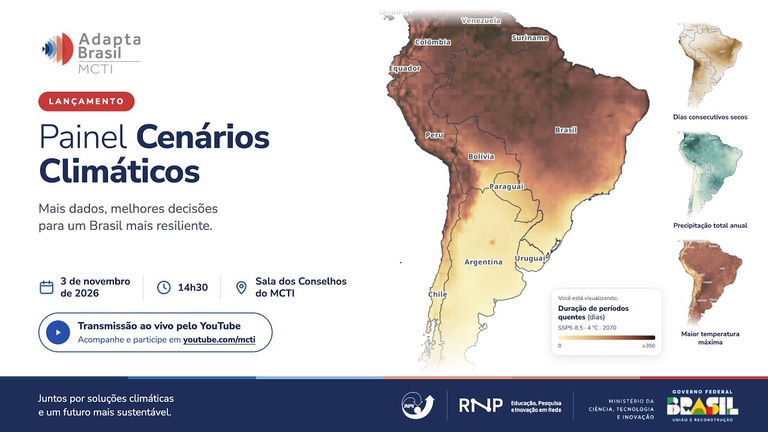
The Ministry of Science, Technology and Innovation (MCTI) launched, on November 3, in Brasília, the Climate Scenarios Panel, a new feature of the AdaptaBrasil platform, developed with the National Education and Research Network (RNP) and the National Institute for Space Research (INPE). According to the INPE note (in Portuguese), the tool now shows temperature and rainfall projections for all of Latin America, at 10-kilometer resolution, and lets users compare different levels of global warming.
What the panel is
AdaptaBrasil already gathered climate risk indicators for Brazil's 5,570 municipalities. The new panel adds maps of climate change projections, and the INPE note highlights that this is the first time the platform works with information not devoted only to risk. The maps show how temperature and precipitation may change in the coming decades at four levels of global warming: 1.5 °C, 2 °C, 3 °C and 4 °C.
Users choose an indicator and a warming level and see the result on the map. The panel page offers quick-access questions, such as whether heat waves will last longer, where there will be more droughts at 1.5 °C and where it rains most over five days.
What changed
- Coverage. From the scale of Brazilian municipalities to the continent: the note speaks of all of Latin America, and the panel text describes South and Central America.
- 10 km resolution. The note presents the precision as unprecedented and says it allows mapping risks in urban areas. INPE researcher Gilvan Sampaio gave the example of the city of São Paulo, where it would be possible to tell a heavily tree-lined avenue, such as Paulista, from a peripheral area, where heat waves may be more intense.
- Comparison between warming levels. Users can look side by side at what changes at 1.5 °C or 4 °C.
- Navigation and security. According to Christian Miziara, of RNP, the platform now has better data processing and security, easier navigation and faster access.
Which indicators the panel offers
On the panel page, indicators are split into two groups. Under precipitation, there are maximum accumulated rainfall over five days, maximum in one day, maximum consecutive dry days, average daily precipitation and total annual precipitation. Under temperature, there are days with maximum temperature above the 90th percentile, duration of warm spells, highest maximum temperature and lowest minimum temperature. They cover both extreme events, such as heavy rain and heat waves, and trends, such as average rainfall.
Who should use it
The note cites researchers, public managers, states, municipalities, civil society and anyone who needs to plan adaptation actions. Jean Ometto, head of the AdaptaBrasil Strategic Projects Division at INPE, said climate projections are central to calculating risks in planning. The Ministry of the Environment and Climate Change was cited as a user to support decisions, and the tool will also be presented to the Community of Latin American and Caribbean States (CELAC) and the European Union. The note says the expansion foresees new developments and updates throughout 2027.
What this means for projects and licensing
Environmental studies, risk management plans and adaptation programs usually depend on scenarios for the future, and until now gathering this data took more technical work. A public tool, with a map and finer resolution, makes three practical uses easier.
- Project risk diagnosis. Comparing what changes at the project site, in temperature and rainfall, under different warming levels helps ground the analysis of physical risks, such as drought, extreme heat and heavy rain, in studies and reports.
- Dialogue with communities and agencies. A map showing where heat or rain tend to weigh most helps explain risks visually and prioritize measures in more exposed territories. It is the kind of information that the Ibama El Niño adaptation guides ask to be brought into licensing.
- Reporting and financing. Warming scenarios are the basis of climate risk analyses that banks, investors and reporting standards increasingly ask for.
Limits to consider
The INPE note and the panel do not describe the climate models, time horizons or methodology of the projections, and the page we consulted has no link to technical documentation. Before using the maps in formal studies, it is worth checking the methodology with MCTI or INPE. Projections by warming level show trends, not forecasts for a specific year, and 10 km resolution does not replace a project's local study. It is a starting point for the diagnosis.
Talk to KICK
KICK Group works on socio-environmental communication and stakeholder engagement for projects, including the social side of licensing and adaptation programs. If your project needs to bring climate risk into dialogue with the territory, it is worth talking.
Write to contato@kickgroup.com.br. Sources: INPE note (11/4/2026) and AdaptaBrasil MCTI Climate Scenarios Panel (both in Portuguese). Informational text, updated as of November 6, 2026.
Keep reading
Ibama guides prepare ports, transmission lines and hydropower plants for El Niño
Ibama released three climate adaptation guides for El Niño 2026-2027. See what they bring for ports, transmission lines and hydropower plants, the role of communities and financing.

KICK develops ESPM's first Sustainability Report
The report, with 2025 data, uses the GRI Standards as a reference and relates to MEC assessments, the Ethos Indicators and the SDGs. See how it was developed and what it shows.
Letter at COP31 calls for political leadership to end deforestation by 2030
More than one hundred organizations, Indigenous peoples and research institutions call for an implementation process through 2030 and an international meeting in 2027. See what the letter says, the COP30 Roadmap and what changes for companies.