

Interactive dashboard maps risk and exposure of mining dams in Brazil
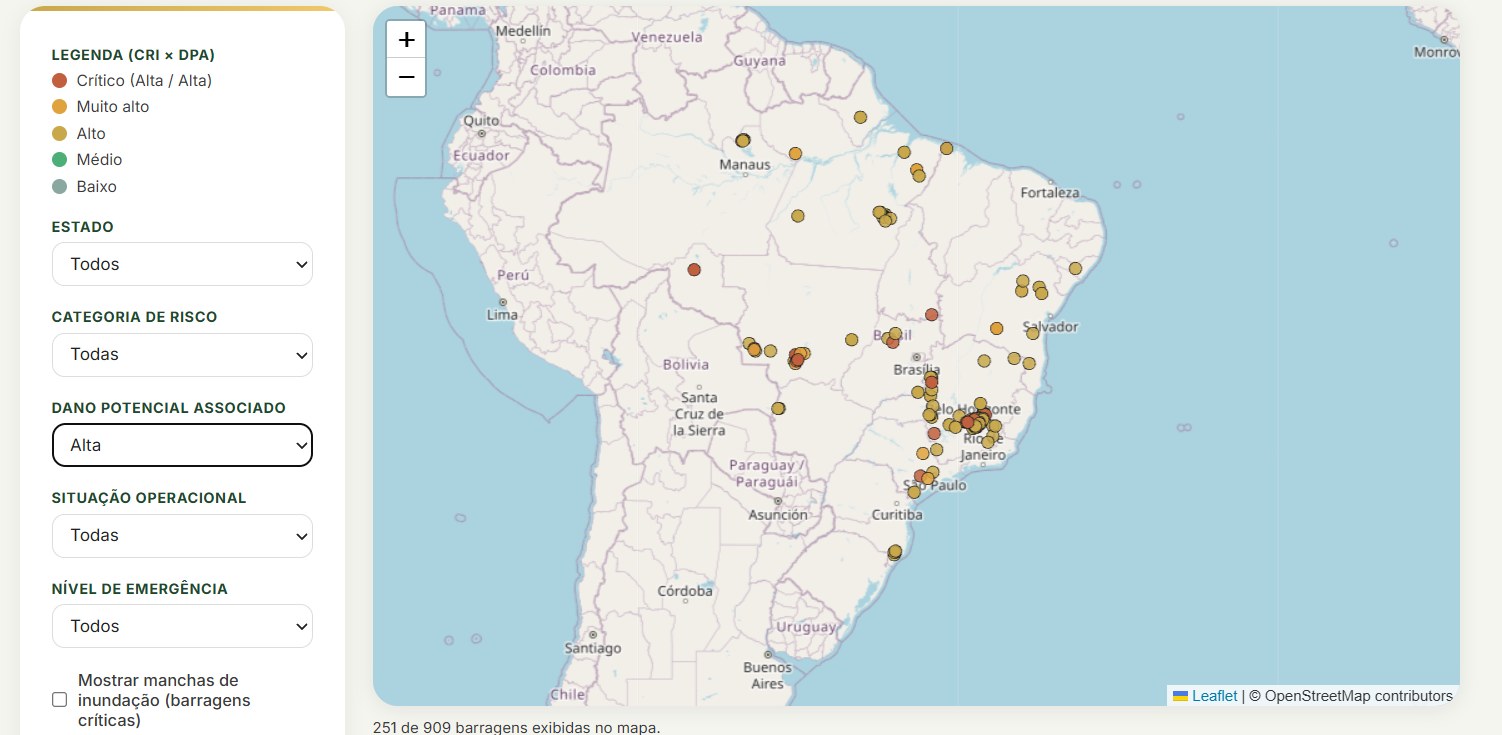
Brazil has hundreds of registered mining dams, but finding in one place which ones are the most critical, where they are and how many people live nearby is not simple. To shorten that path, Mariana Klein, a partner at KICK and a researcher at LAPAJ (the Environmental Policy and Justice Research Laboratory at Ufes), built an open dataset and an interactive dashboard on the topic. The dataset was published on the Harvard Dataverse.
The dataset: “Mining Dams in Brazil”
The work, titled Barragens de Mineração no Brasil: Classificação de Risco, Manchas de Inundação e Exposição Populacional (Mining Dams in Brazil: Risk Classification, Flood Maps and Population Exposure), cross-references the public dam registry of Brazil's National Mining Agency (ANM) with IBGE population data. For each dam, it gathers location, responsible company, risk category (CRI), associated potential damage (DPA), operational status, construction method and emergency level.
For the most critical dams, those with both CRI and DPA rated “High” or with an active emergency level (73 of about 909 at the time of extraction), the dataset also includes the flood map polygon, the area that would be hit in case of failure, and an estimate of the resident population inside it.
The files are available in open formats (GeoJSON and JSON) under a CC0 license, with a Python script that allows rebuilding or updating the base from the original sources. Since the ANM's official bulletins are only released as PDFs, the data was extracted from the public geospatial service that feeds the agency's dashboard.
What the dashboard shows
Built on this dataset, the dashboard lets you explore the data without any software:
- Dam map: each point is a dam, colored by the combination of risk and potential damage, from “critical” to “low”, with the option to display flood maps.
- National overview: charts by state, risk category, potential damage, operational status, construction method and emergency level.
- Exposure by municipality: municipalities with the most dams, their population and an estimate of people in the flood area.
- Historical cases: a timeline of failures, such as Mariana (2015) and Brumadinho (2019).
- Searchable list and filters by state, risk, potential damage, status and emergency level.
- Territorial conflicts: a page that crosses municipalities with dams with records of mining conflicts and Ibama fines.
In the current version, the dashboard shows 909 registered dams, 72 of which have a high risk category and 72 are at an emergency level, and about 26.6 million people live in municipalities with at least one dam. The numbers vary with the data extraction date.
How to read these numbers carefully
The author is explicit about the work's limits, and they apply to anyone using the data:
- it is an independent initiative, with no official link to the ANM, IBGE or the federal government;
- the population estimated in the flood map is calculated by area interpolation, assuming uniform density in each census tract. It is an approximation, not a headcount;
- the flood maps have simplified geometry for visualization and are not suitable for engineering analysis;
- municipal population is just a rough exposure indicator;
- classifications and operational status may change after the extraction date, and technical, safety or legal decisions should always rely on the official source.
Why this matters for the ESG agenda
Open, organized data on territorial risks helps turn discourse into analysis. For companies, financial institutions and government, it supports risk management, value chain due diligence and transparency. And the topic is increasingly present in regulation: in the central bank's new GRSAC report, for example, the credit portfolio must be crossed with public registries, including the ANM's registry of tailings dams at emergency level.
Cite and use
The dataset is free to use. To cite:
KLEIN, Mariana. Barragens de Mineração no Brasil: Classificação de Risco, Manchas de Inundação e Exposição Populacional. Harvard Dataverse, 2026. DOI: 10.7910/DVN/HALBJD.
Talk to KICK
KICK Group turns data into information for decisions: risk analysis, materiality, indicators, dashboards and ESG reporting, including through the B.KICK platform. Want to know how to organize your company's or institution's data?
Write to contato@kickgroup.com.br. Links: dashboard and dataset on the Harvard Dataverse.